Recent enhancements to GamePlan include:
- Critical path calculation
- Reporting on groups of activities
- Reporting on people
- Milestone due date on the Gantt chart
- Gantt chart auto-scroll
1. Critical path calculation
The critical path in a project is defined as the sequence of activities with the longest duration that must be completed on time in order for the project to complete on time.
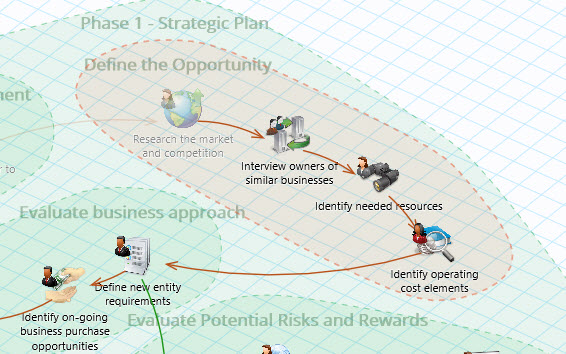
The critical path is now calculated and graphically displayed on the Whiteboard in real time as you create your plan. The critical path is displayed with orange arrows.
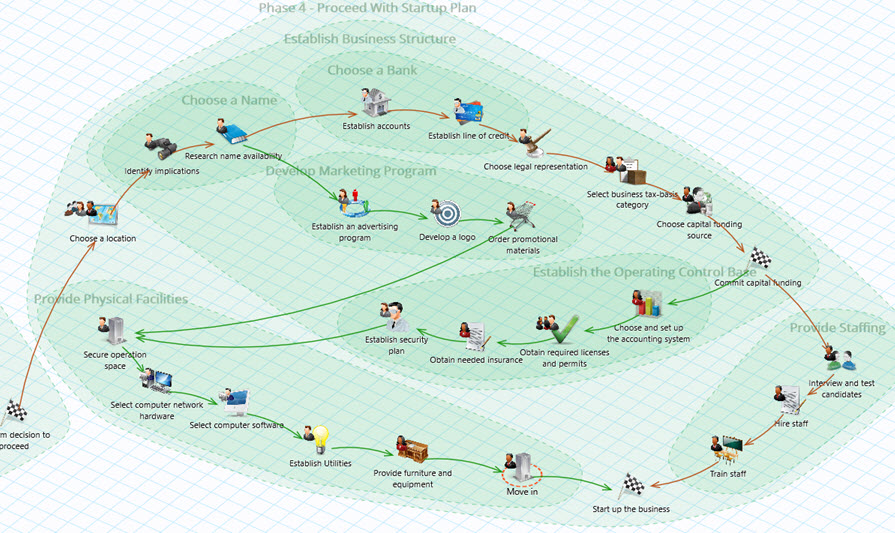
The critical path clearly shows you which tasks to focus on if you are to complete your project on time.
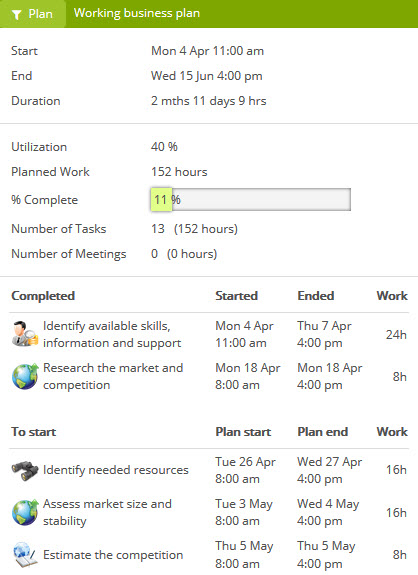
2. Reporting on groups of activities
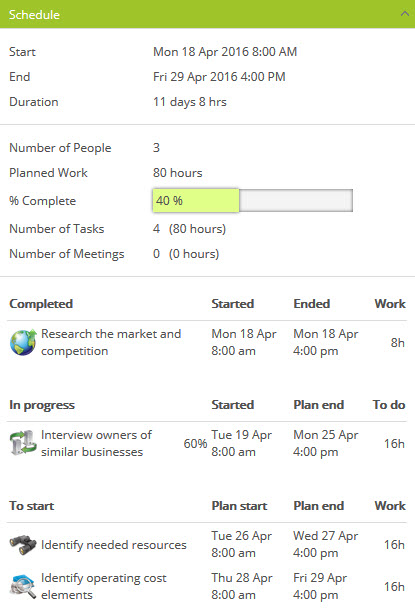
Whenever a group of activities is selected on the Whiteboard, information on the selected group is now reported.
The report shows when the group starts and finishes, the total planned work, the % complete, as well as the schedule for each activity within the group.
3. Reporting on people
Whenever a person is selected, information on that person is now reported in the panel to the right of the Whiteboard.
The report shows when the person starts and finishes on the project, their utilization within this start and finish time, their total hours of planned work, their % complete, as well as the schedule for their activities.
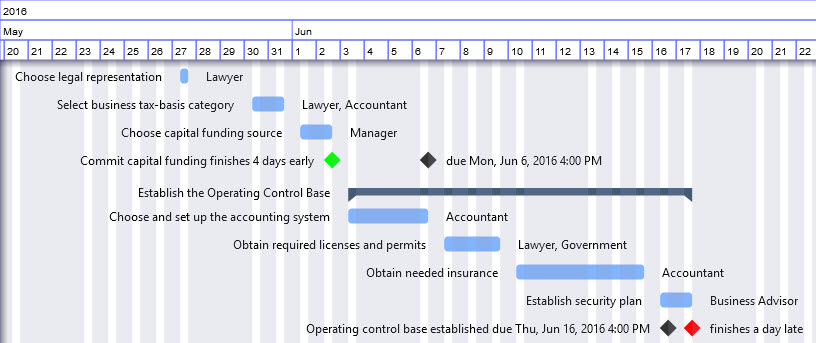
4. Milestone due date on the Gantt chart
The Gantt chart now displays two symbols for each milestone:
- when the milestone will be achieved (based on the current schedule)
- the milestone due date
The milestone due date is shown in black, and when the milestone will be achieved is shown in either green or red, depending on whether the due date will be made or missed. This gives a clear visual indicator as to whether or not you are on track to achieve your milestones on time.
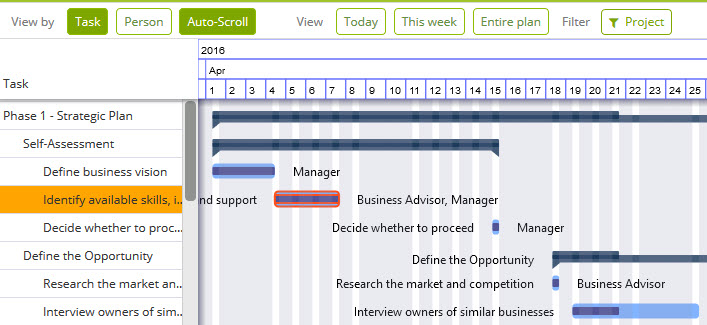
5. Gantt chart auto-scroll
A new button above the Gantt chart, Auto-Scroll, enables automatic scrolling of the Gantt chart whenever an item on the Whiteboard is selected. When you select an item on the Whiteboard, the Gantt chart automatically scrolls vertically so that the selected item is visible. This lets you quickly see the start and finish dates for a task without having to manually scroll the Gantt chart to find the task.