Version 1.6.16055.1 was released on February 24, 2016.
This update contains two significant enhancements.
Multiple projects within a plan
Prior to this enhancement, a plan contained one whiteboard. This worked well for planning one project, but not for planning multiple projects within a single plan.
A single plan can now contain any number of whiteboards, as shown below.
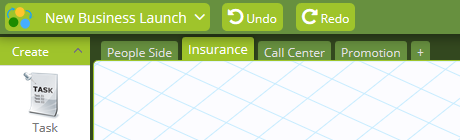
This works very well for planning multiple projects within a single plan. The reason to manage different projects within one plan is that a person working across different projects will not be scheduled to work on tasks in different projects at the same time. Resource levelling takes into account all projects within the plan.
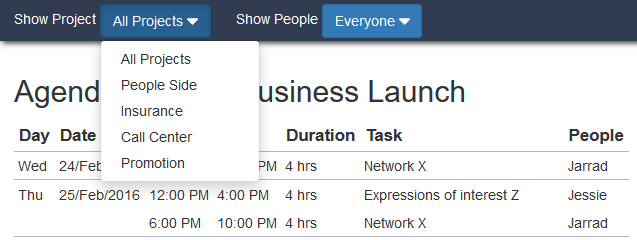
Reporting can be on a specific project or on the entire plan. For example, the Agenda report can be filtered by project and by person.
Similarly, the Gantt chart can show the entire plan or a specific project.
Tasks with no people assigned are now scheduled in parallel
This enhancement has far reaching implications and users will notice the difference when they create new tasks. Prior to assigning a person or a link or a start constraint to a new task, each new task will be scheduled at the plan start date. Before this enhancement, new tasks would be scheduled one after the other, in the order in which they were created.
The reason for this change is to allow GamePlan to be used to calculate resource (people) requirements. Once links (task dependencies) have been added to tasks, GamePlan gives the best case schedule, which shows how many people are needed and when they are needed if this schedule is to be achieved. After viewing the best case schedule, the next step is typically to assign people to tasks, and GamePlan then gives an achievable schedule based on the available working times of the people assigned.