1. You can now set the minimum and maximum number of resources that can work on a task at one time. This request came from a user who wrote:
I notice that when I assign 7 welders to a task (because they are all capable of performing it) it splits the task into 1/7th of the time and everyone is assigned to it.
My intention is that if I specify 2-3 workers (for example), then the task will not start to be performed unless there are 2 workers available and will be assigned a 3rd worker if available. This is similar to the function that you have not to start a task until all members are available, but has a greater degree of control and would be very useful.
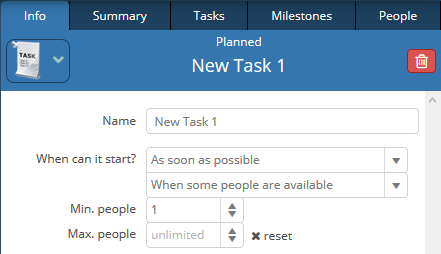
When more than one person is assigned to a task, you now have a third option in the field “When can it start?”
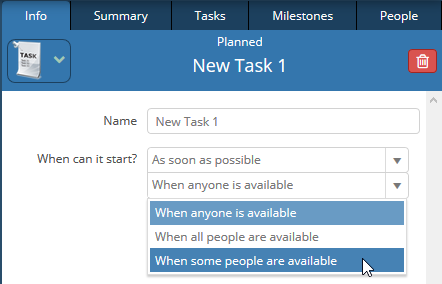
If you choose “When some people are available” two additional fields are shown where you can enter the minimum number of people that must be available for the task to be worked on and the maximum number of people that can work on the task.
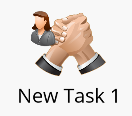
While doing this development, we enhanced the Gantt chart to show only people who work on a task. Previously the Gantt chart showed all people assigned to a task.
2. You can now choose to show text instead of icon images on the Whiteboard to represent people. This request came from another user who wrote:
Related to icons, using gender and skin colour to make people recognizable by icon in gameplan feels uncomfortable – could you add an option to use a nickname or initials for user instead of an icon?
We have added a field in the Person properties to support this.
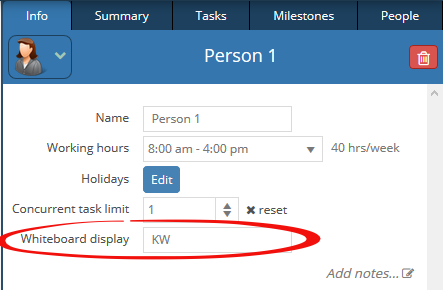
Text from this field will be displayed on the Whiteboard in place of the icon.

3. All dialogs in GamePlan can now be applied using Control-Enter on the keyboard.
4. Projects are now sorted alphabetically when moving items across projects or linking to and from projects.
5. Improved visibility of the Today button on the calendar.