What is the difference between a static and dynamic report? Static reports give information from a snapshot in time, whereas dynamic reports give continual access to real-time data.
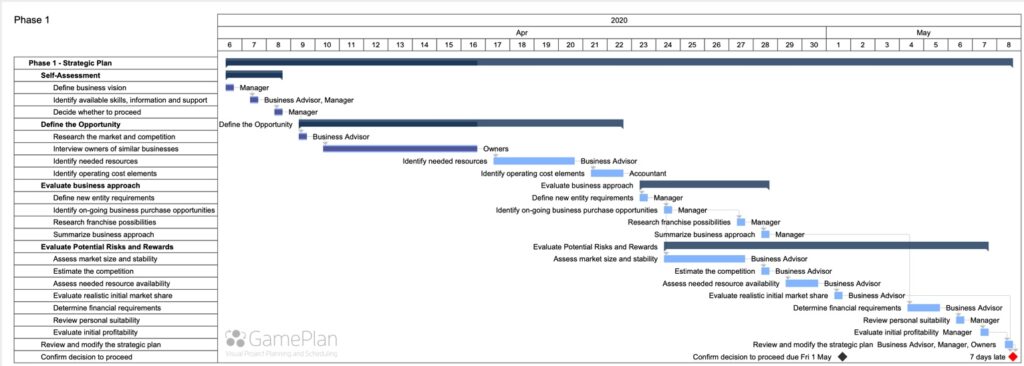
An example of a static report is our Gantt chart PDF, shown below. At the time it is generated, it contains the most up-to-date data. It can be easily shared and printed, so that everyone has the same data for making business decisions. However, static reports have a short shelf life. After being used, they are often filed away.
Dynamic reports give online access to real-time data through a web browser. Dynamic reports are accessible anytime, are always up to date, and can easily be shared.
GamePlan’s Gantt chart can now be shared in a dynamic report. The dynamic report is interactive, so viewers can interactively zoom the time interval, group the Gantt chart by task or by person, and show the critical path.
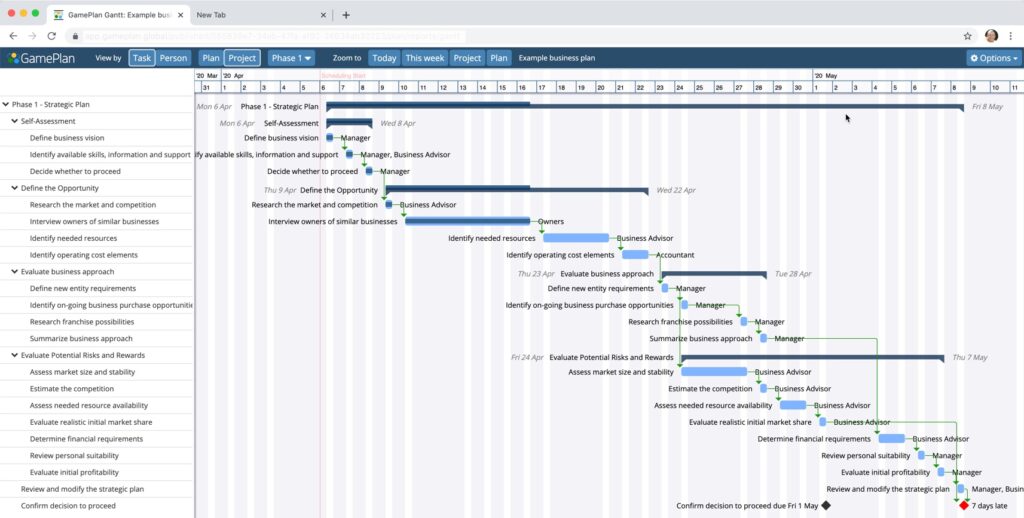
Another benefit of dynamic reports is that they do not require a GamePlan account. Simply bookmark a dynamic report, and then, with a single click, view it from anywhere on any device. The Gantt chart shows project progress towards milestones, which makes it easy to stay up to date on your project status.
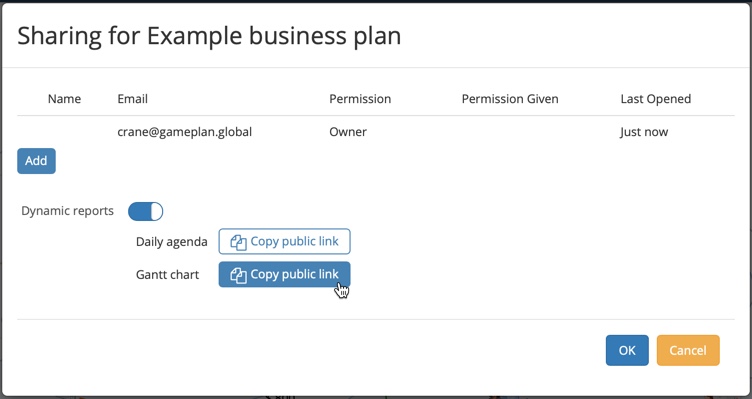
On the Share Plan… dialog, enable Dynamic reports. There are currently two dynamic reports in GamePlan, the Daily agenda and the Gantt chart. Each report has its own public URL. To share a dynamic report, click Copy public link and paste the URL into an email or a shared document.
Are there other reports in GamePlan that you would like to share with others dynamically? If so, please let us know.