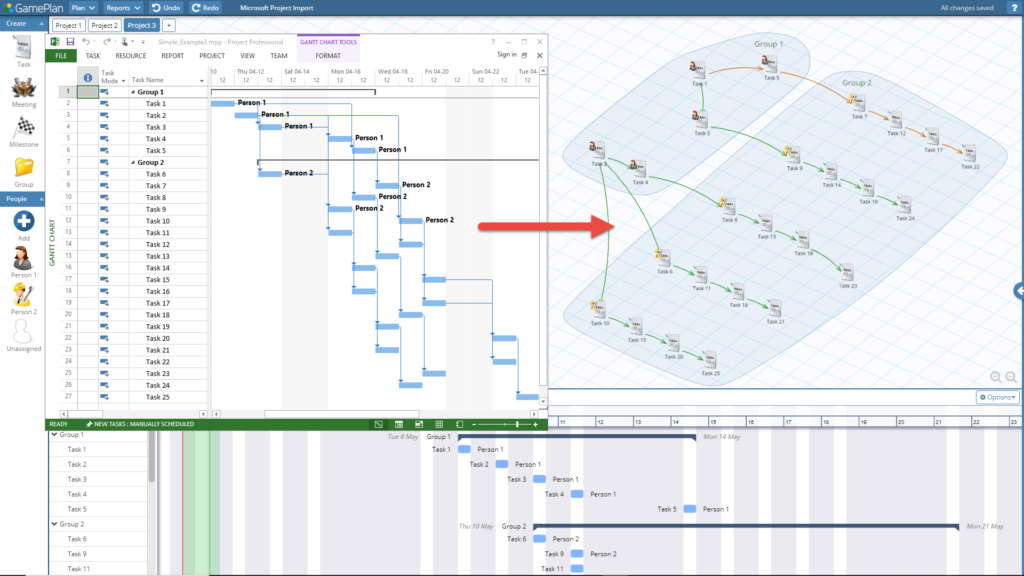
1. Microsoft Project Import
GamePlan can now visualize Microsoft Project .mpp files!
We can’t find any other product in the world that can do this. So we are giving 20 million Project users (according to the Microsoft website) a way to effectively communicate their project plans.
Further information and a video can be found at www.gameplan.global/solutions/visualize-microsoft-project
2. Performance Enhancements
As we developed the Project import, we imported some pretty big Microsoft Project schedules. This showed us bottlenecks in our performance, which we fixed. The GamePlan UI is now a lot snappier, i.e. it reacts more quickly to your mouse interactions.
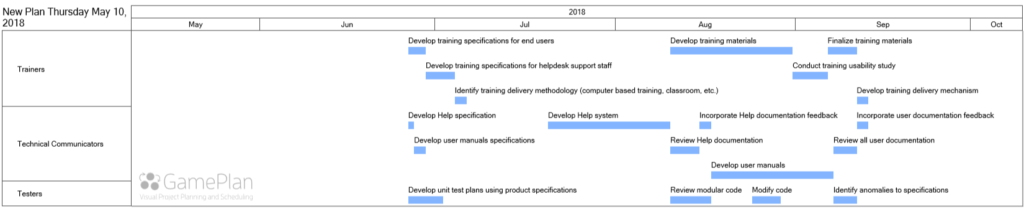
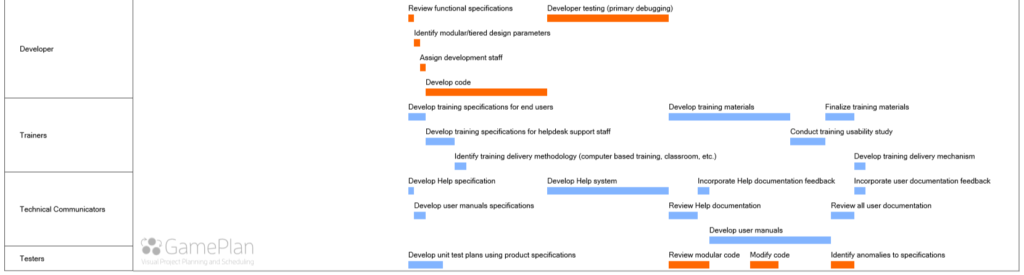
3. Gantt chart by Person PDF
We now support PDF output for the Gantt chart grouped by person. This allows you to easily see all tasks for each person and when each task starts and finishes. (We have now started the work to improve the display of this chart in the app.)
4. Critical Path display on the Gantt chart PDFs
You can now show the Critical Path tasks on the Gantt chart PDF. Both by task and by person Gantt charts can show the critical path.
The orange bars below show the critical path tasks within this project. (This project is the Software Development Plan template, imported from Microsoft Project.)
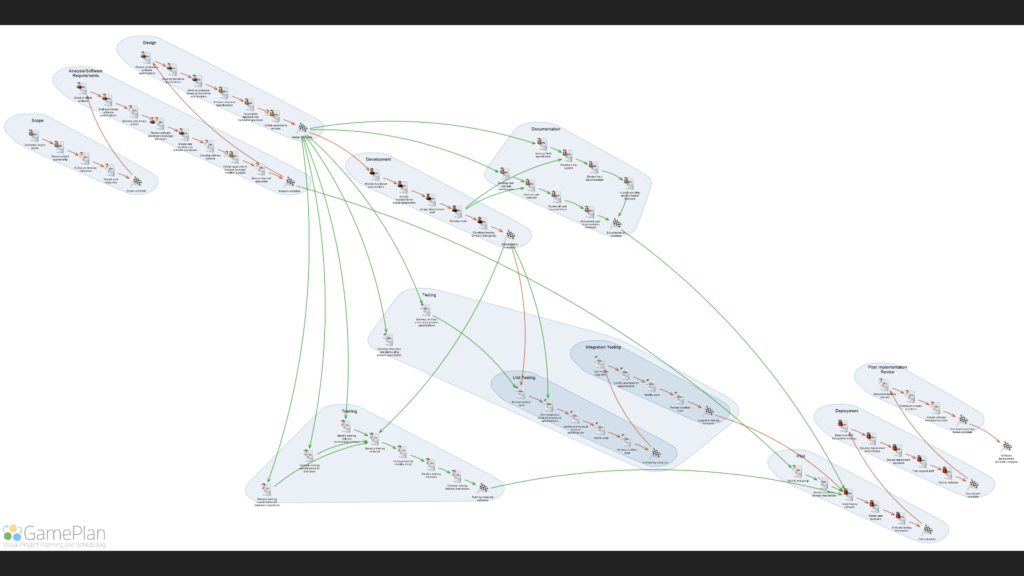
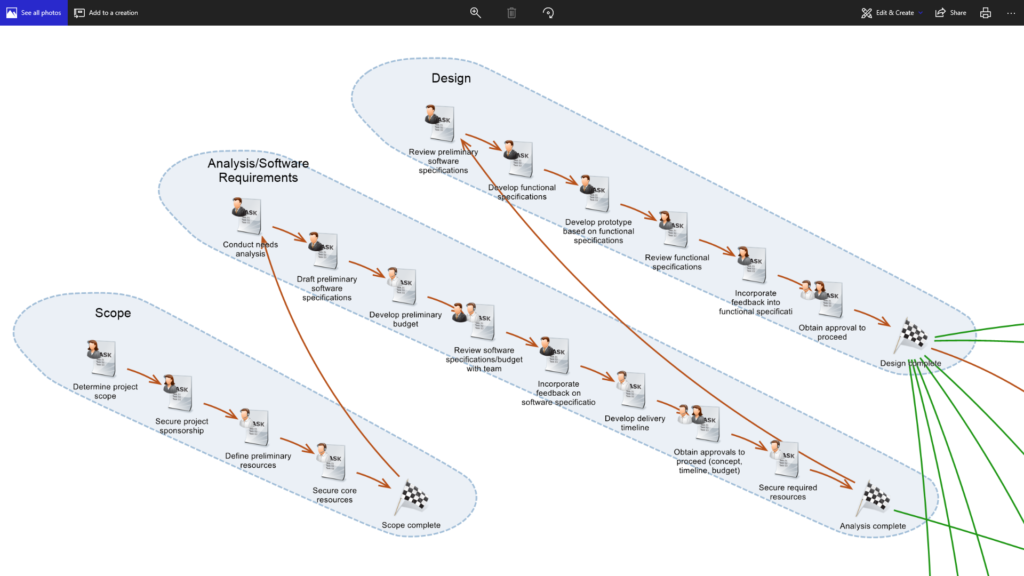
5. Whiteboard Image PNG output
Saving the Whiteboard image to PNG has been improved. Previously the PNG resolution was always 4,096 pixels in the largest dimension. Now the resolution of the PNG is optimized based on the contents of the Whiteboard. The PNG resolution can reach 12,000 pixels in each dimension, in order to make task labels still readable for large projects. When the resolution of the PNG is greater than 4,096 pixels, the background grid lines are no longer drawn to reduce the PNG file size.